
Purpose of this post is to determine cake resistance in filtration systems, as a function of operating pressure of filter. Before we jump into the calculation, let us learn first several basic calculation in filtration system.
As filtration proceeds, a porous cake of solid particles is built up on a porous medium, usually a supported cloth. The flow of liquid is laminar because of the fineness of the pores. Therefore, the following equation represented the phenomena:
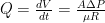
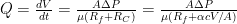
The resistance R is made up of filter cloth Rf and that of cake Rc which may be assumed proportional to the weight of the cake.
Where:
α = specific resistance of the cake (m/kg)
c = weight of solids per volume of liquid (kg/m3)
μ = viscosity (N sec/m2)
P = pressure difference (N/m2)
A = filtering surface (m2)
V = volume of filtrate (m3)
Q = rate of filtrate accumulation (m3/sec)
Rf and α are constants of the equipment and slurry and must be evaluated from experimental data.
The simplest data to analyze are those obtained from constant pressure or constant rate tests for which the equations will be developed.
At constant pressure, the equation above is integrated as linear form as below:

The constants Rf and α are derivable from intercept and slope of the plot t/V against V.
Resistivity of filter cakes depends on the conditions of formation of which the pressure is the major one. At increasing pressures, the particles or aggregates may be distorted and brought closer together. Equation below show relationship between specific resistivity of cake and pressure differences.

Example
In this example, we want to determine filter cloth resistance and cake resistance as a function of pressure from laboratory filtration test.

Filtration tests were performed on calcium carbonate slurry with the following properties:
Weight of solids per volume of liquid (c) = 135 kg solid/m3 solid
Dynamic viscosity (μ) = 0.001 N sec/m2
Area of the filter leaf was 500 cm2.
Data were taken of the volume of the filtrate (L) against time (sec) at pressures of 0.5 and 0.8 bar. The results will be analyzed for the filtration parameters:
| Vol of Filtrate (L) | V/A (m3/m2) | 0.5 bar | 0.8 bar | ||
| t | t/(V/A) | t | t/(V/A) | ||
| 0.5 | 0.01 | 6.8 | 680 | 4.8 | 480 |
| 1 | 0.02 | 19.0 | 950 | 12.6 | 630 |
| 1.5 | 0.03 | 36.4 | 1213 | 22.8 | 760 |
| 2 | 0.04 | 53.4 | 1335 | 35.6 | 890 |
| 2.5 | 0.05 | 76.0 | 1520 | 50.5 | 1010 |
| 3 | 0.06 | 102.0 | 1700 | 69 | 1150 |
| 3.5 | 0.07 | 131.2 | 1874 | 88.2 | 1260 |
| 4 | 0.08 | 163.0 | 2038 | 112 | 1400 |
| 4.5 | 0.09 | ||||
| 5 | 0.1 | ||||
The first step is to create a figure as a function of V/A and t/(V/A).

Based on intercept, we can obtain resistance of filter cloth (Rf ) and based on slope we can get specific resistivity of cake (α).
| Pressure (bar) | Pressure (Pa) | Slope | Intercept | Rf (Resistance of filter cloth) (m-1) |
α (specific resistance of cake) (m/kg) |
| 0.5 | 50000 | 18773 | 569 | 2.8.E+10 | 1.4.E+10 |
| 0.8 | 80000 | 12952 | 365 | 2.9.E+10 | 1.5.E+10 |
Therefore, resistance of filter cloth is around 3 x 10¹⁰ per meter.
As for specific resistivity of cake as function of pressure:
α = kPn
where n = ln(α1/α2)/ln(P1/P2) = 0.21
k = α/Pn
k = 1.61 x 10¹⁰
Therefore, α = 1.61 x 10¹⁰ P0.21
Example
I made a simple spreadsheet of the above example. I hope you find this post useful. Please download the spreadsheet here.
References:
Walas, Stanley M, “Chemical Process Equipment Selection and Design”, Butterworth-Heinemann, 1990.
2 thoughts to “How to Determine Cake Resistance in Filtration Systems”
Comments are closed.